How to use the dashboards

Interactive data dashboards allow deeper exploration into areas of interest

young woman showing older lady how to use a smartphone
Image showing the ADII dashboard

What are the interactive data dashboards?

The interactive data dashboards allow you to explore the Index data for yourself in a visual and interactive format.

There are several dashboard pages for you to explore. Each page focuses on a specific aspect of the Index, and contains insights, charts, and visualisations.

On each page, you can manipulate what is shown on charts, graphs, and tables, as well as filter and export the data.

Video showing how to navigate to the dashboard

Navigating to the dashboard

To enter the interactive data dashboards, select ADII dashboard or First Nations dashboard from the main menu.

Once you are in the dashboard platform, you can navigate to other pages by using the menu on the left, or navigate back to the website by clicking or tapping the ‘back to website’ button in the top right corner of the screen.

Video showing users how to change the way data is displayed

Changing how data is displayed

On each dashboard page, the toggle menu on the left allows you to control how data is displayed. This includes

  • Year. Select the year to update charts, tables, and time series.

  • View by. Choose how to view the data (e.g. by gender or age).

  • Measure. Switch between measures such as ADII score, Access score, Affordability score, or Digital Ability score.

  • Show or hide data labels to reduce clutter. Hover or tap a point to see exact values.

Video showing how to interact with charts and tables in the ADII dashboard

Interacting with charts and tables

As you explore the dashboard, you will find different ways to interact with visualisations. Depending on the visualisation, you can:

  • Toggle between data series within a data visualisation.
  • Hover or tap charts to see exact values in a popup.

  • Turn on (or off) data series in time series charts by clicking items in the legend.

  • Sort tables by clicking any column heading (ascending or descending).

  • Use drop downs (when available) to switch metrics within a tile.

  • Zoom in to view the data visualisation in full page view.

Filtering the data

On some of the dashboard pages, you can filter results using the filter menu.

Click the filter icon beneath the toggle menu, then choose from the available filters (e.g. select an age group such as 18–39). Once selected, click Apply in the bottom left to update the data.

You can change filters anytime by reopening the menu, resetting, and applying a new filter.

Note: Only one filter can be used at a time, and applying filters may hide data if sample sizes are too small.

Filter and sample size indicators

Filter details appear at the bottom of each page. When a filter is applied, the filter indicator will turn green, and the filter applied will be shown.

You may also see these indicators:

  • Low sample size: A yellow indicator will appear if a data series has fewer than 50 respondents, with a warning at the bottom of the page.

  • Insufficient sample: A red indicator will appear if a data series has fewer than 30 respondents. The series will not be shown in charts, tables, or graphs.

  • Filtered / unfiltered: Some visualisations are grouped by subgroups and cannot be filtered. Indicators beside each tile heading show which tiles are affected by the filter you have selected.

Video showing how to export the data from the ADII dashboard

Exporting data

You can export the data that is shown on each dashboard page to either PDF or Excel format.

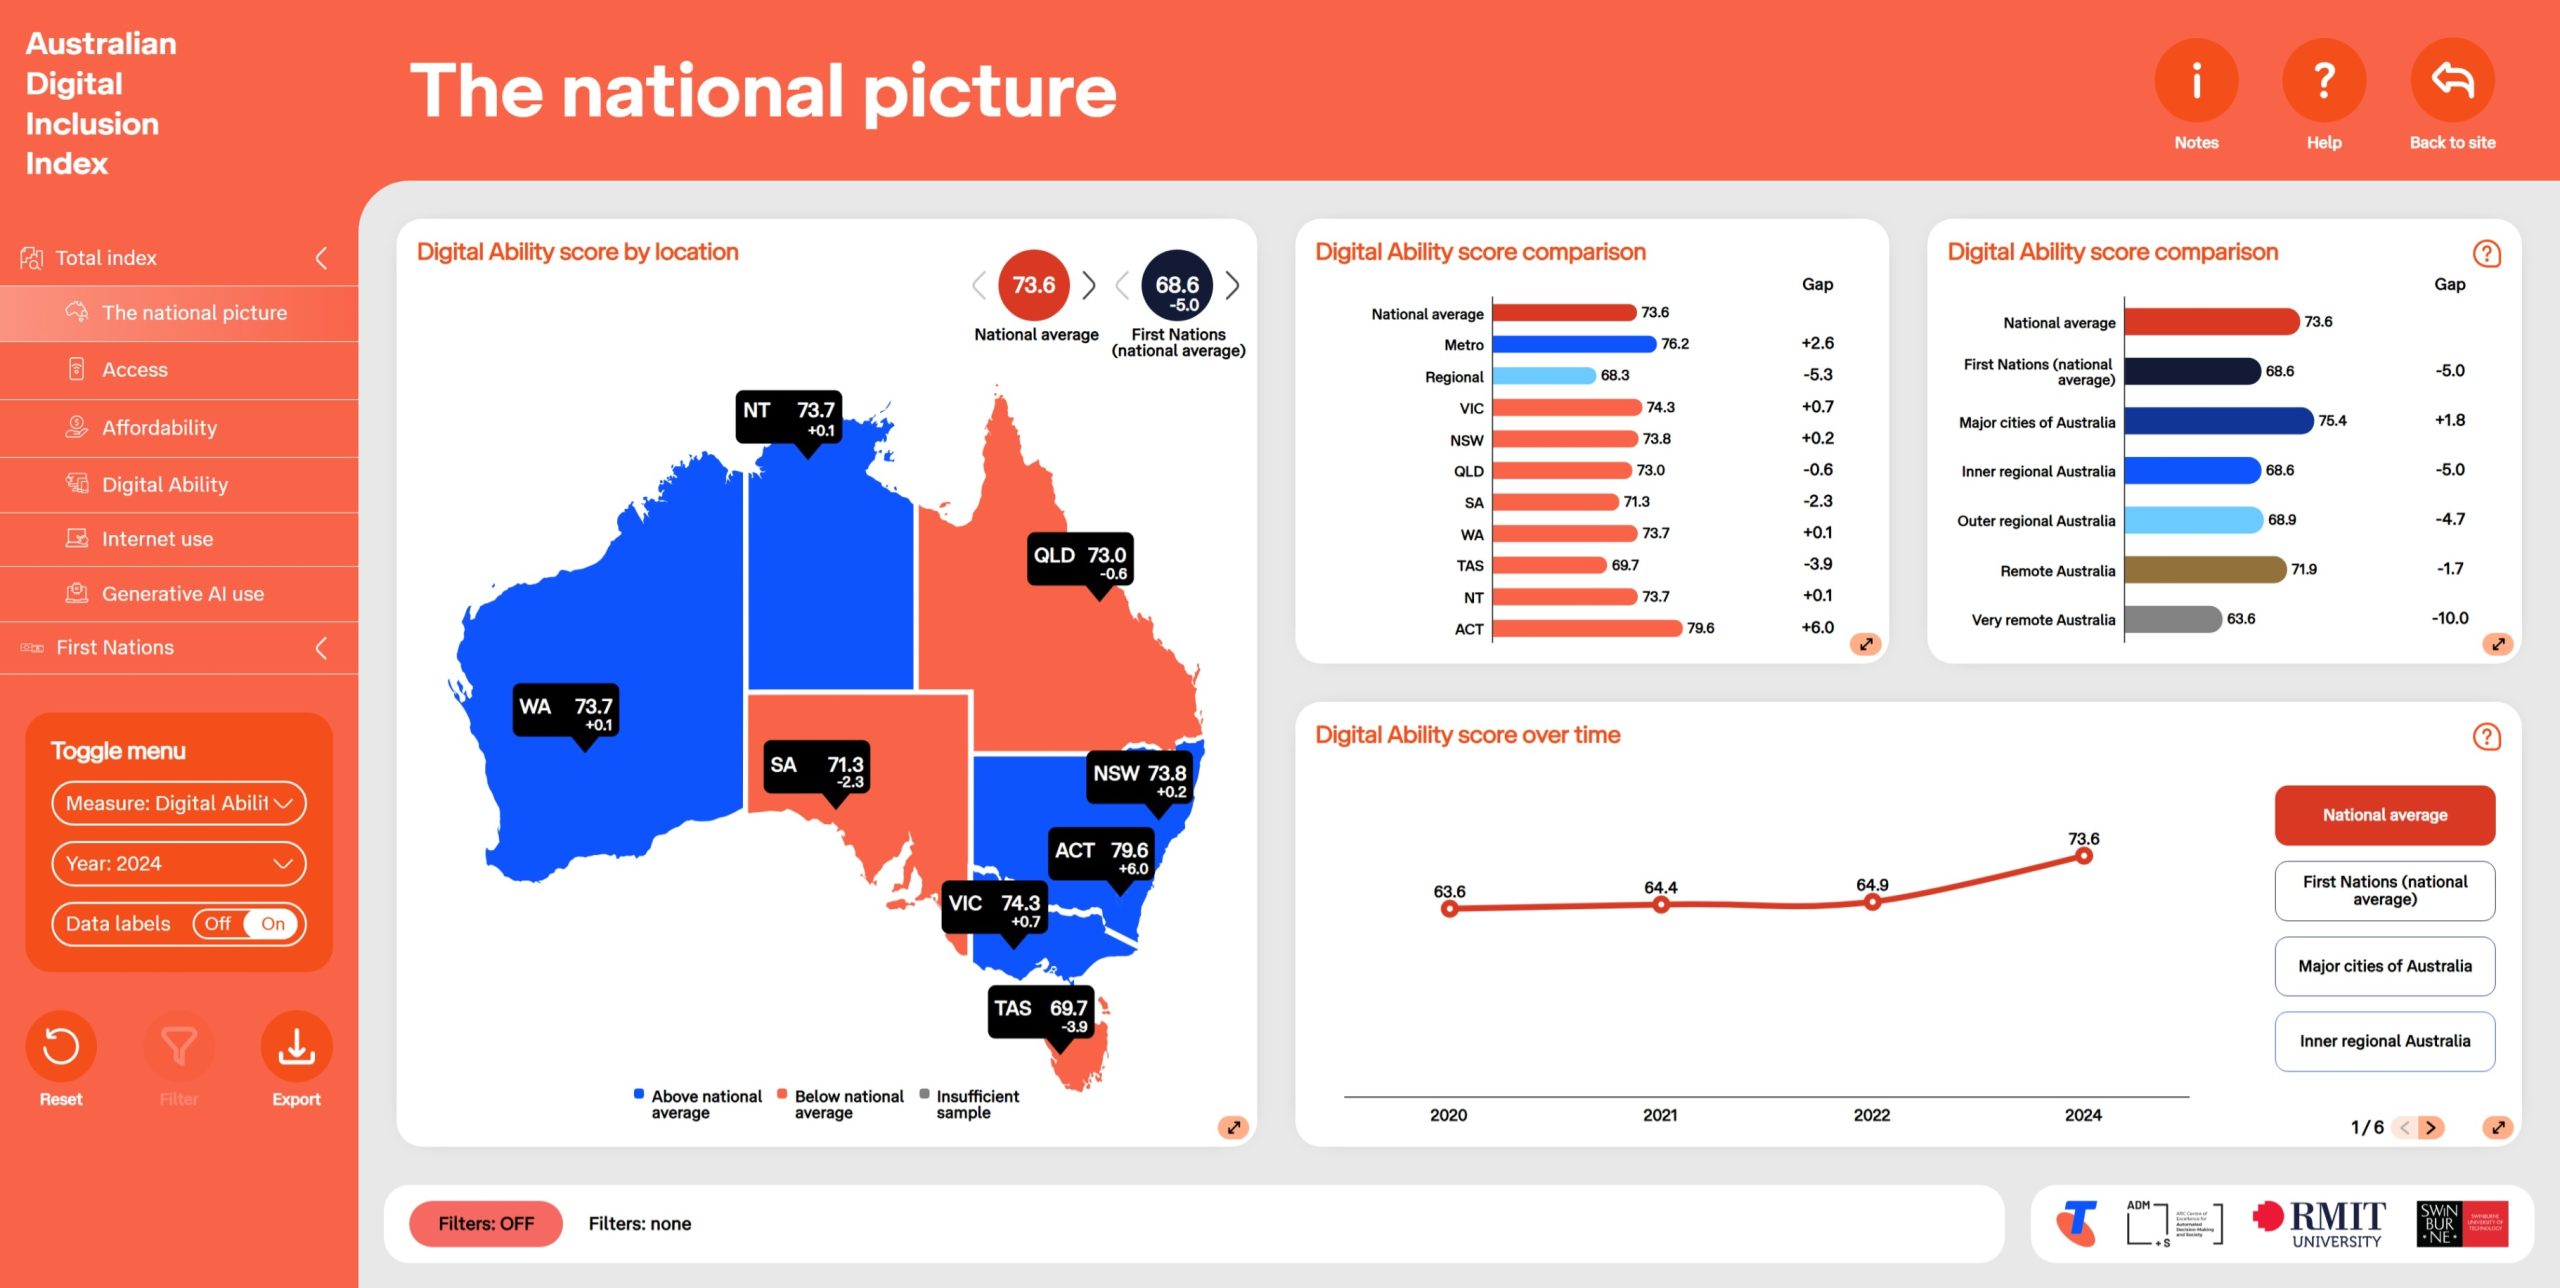
To export data, open the export menu by clicking on the export icon beneath the toggle menu.

Select the format you would like to export to, either PDF or Excel.

A dialogue box will open prompting you to save the exported file to your device. Select a location to save your file and then click save.

Please note that the PDF and Excel export will export the entire page, including the data cuts you have selected, and any filters you have applied.

Resetting the page

To reset the page back to its default state, click or tap the reset button located beneath the toggle menu.

This will remove all filters, and toggle menu selections, and allow you to start fresh.